> ## Documentation Index
> Fetch the complete documentation index at: https://docs.hextrade.io/llms.txt
> Use this file to discover all available pages before exploring further.
# Trading Analytics
> Use Hextrade's analytics tools to evaluate account performance, monitor P&L, and make data-driven trading decisions.
# Trading Analytics
Hextrade provides powerful analytics tools designed to help you evaluate account performance, mitigate risk, and make informed adjustments to your strategy. Whether you're reviewing overall trends or drilling into a single account, the data is always at your fingertips.
***
## ️ Two Ways to Access Analytics
An overview of **all accounts combined** — major performance indicators, trends, and a simplified view of your overall trading activity.
Drill into the **performance of a single account** — detailed P\&L, trade history, risk metrics, and account-specific data.
***
## General Analytics
Visit [**Hextrade General Analytics**](https://dash.hextrade.io/analytics) for a comprehensive overview of your trading performance across all connected accounts.
What you'll find:
* **Overall P\&L** — Combined profit and loss across all accounts.
* **Trade volume** — Total number of trades executed.
* **Win rate** — Aggregate success rate across your portfolio.
* **Performance trends** — Charts showing performance over time (daily, weekly, monthly).
* **Risk indicators** — Drawdown and other risk metrics at the portfolio level.
This guide covers the `/analytics` page (account performance). For the `Analytics` tab in Portfolio Builder, see [Portfolio Analytics](/portfolio/analytics).
***
## Account-Specific Analytics
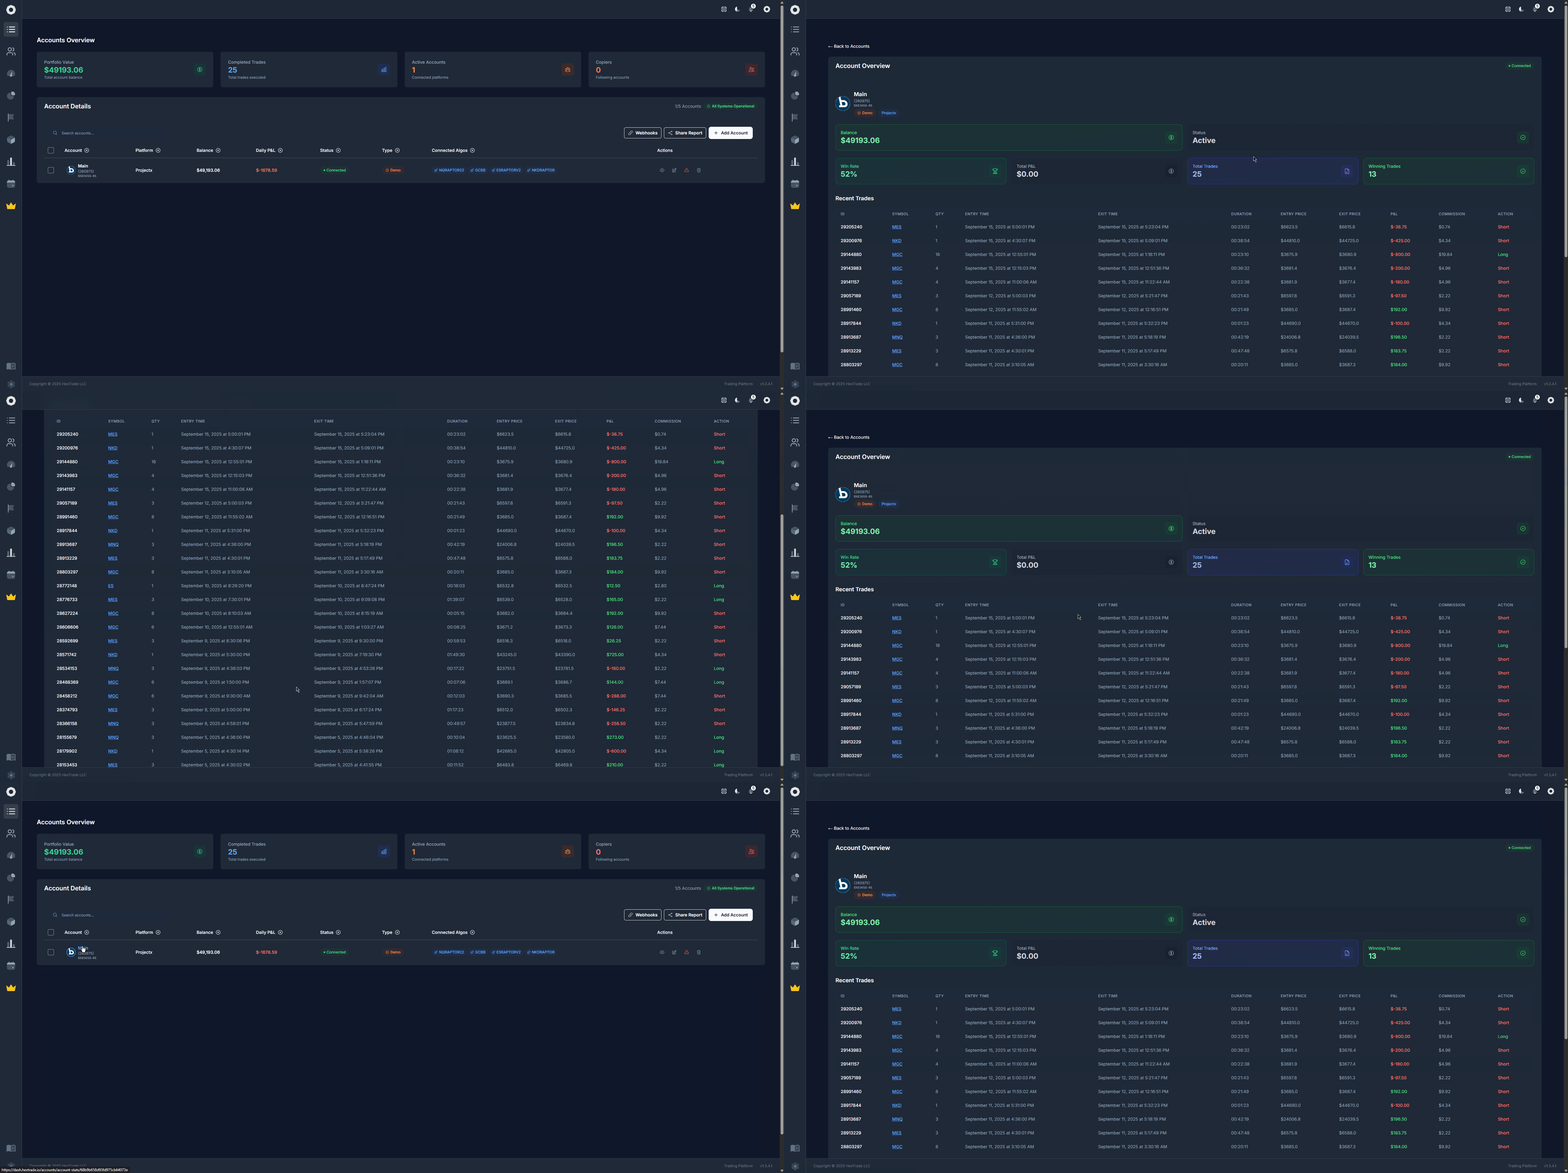
Navigate to [dash.hextrade.io/accounts](https://dash.hextrade.io/accounts). You'll see a table listing all your connected accounts.
Click the **Eye icon** or directly on the **account name** in the table to open its detailed analytics page.
The account analytics page shows:
* **Balance and buying power**
* **Open and closed positions**
* **Trade history** with entry/exit prices
* **P\&L by day, week, month**
* **Algorithm performance** (if using an automated strategy)
* **Risk metrics** including max drawdown
 ***
## Key Metrics Explained
| Metric | What it means |
| ----------------------- | ------------------------------------------------------------------------------ |
| **P\&L** | Profit and Loss — total gains minus total losses for the period. |
| **Win Rate** | Percentage of trades that closed in profit. |
| **Drawdown** | The largest peak-to-trough decline in account value — key for risk assessment. |
| **Total Trades** | Number of trades executed; higher volume = more reliable stats. |
| **Avg. Trade Duration** | How long positions are held on average. |
| **Sharpe Ratio** | Risk-adjusted return — higher is better. |
***
## Using Analytics to Improve
Use account analytics to compare the performance of different algorithms on different accounts. If one algorithm consistently underperforms on a specific broker, consider pausing it and trying another.
Monitor **drawdown** closely on funded prop accounts. Most prop firms have a maximum drawdown rule — breaching it will get your account flagged.
* **Compare accounts** — Side-by-side comparison of algorithms running across different brokers.
* **Identify losing periods** — Use the calendar view to spot days or weeks with poor performance.
* **Adjust risk** — If analytics show high drawdown, reduce position sizing or algorithm risk settings.
* **Combine with the Calendar** — Check the [Economic Calendar](/calendar) to correlate losses with major market events.
***
## Key Metrics Explained
| Metric | What it means |
| ----------------------- | ------------------------------------------------------------------------------ |
| **P\&L** | Profit and Loss — total gains minus total losses for the period. |
| **Win Rate** | Percentage of trades that closed in profit. |
| **Drawdown** | The largest peak-to-trough decline in account value — key for risk assessment. |
| **Total Trades** | Number of trades executed; higher volume = more reliable stats. |
| **Avg. Trade Duration** | How long positions are held on average. |
| **Sharpe Ratio** | Risk-adjusted return — higher is better. |
***
## Using Analytics to Improve
Use account analytics to compare the performance of different algorithms on different accounts. If one algorithm consistently underperforms on a specific broker, consider pausing it and trying another.
Monitor **drawdown** closely on funded prop accounts. Most prop firms have a maximum drawdown rule — breaching it will get your account flagged.
* **Compare accounts** — Side-by-side comparison of algorithms running across different brokers.
* **Identify losing periods** — Use the calendar view to spot days or weeks with poor performance.
* **Adjust risk** — If analytics show high drawdown, reduce position sizing or algorithm risk settings.
* **Combine with the Calendar** — Check the [Economic Calendar](/calendar) to correlate losses with major market events.